Basic Linux for System Administrators

As a basic Linux system administrator, the real value is not memorizing commands but understanding context, risk, and impact when you touch production systems.
Prologue: the mistake that changed my perspective
I remember that day clearly. It was a Friday evening in 2013. The sky was dark, and the server room felt even colder.
I was a junior IT support with enthusiasm and, honestly, a bit careless. We had a web app permission error, a tight deadline, and my boss calling every few minutes. In panic, I typed the classic beginner sin: chmod -R 777 /var/www.
“Done,” I thought. “The app is running. I am a genius.”
Three days later, on Monday morning, that server became a spam botnet farm. The website got defaced, the database corrupted, and our IP reputation was blacklisted everywhere. I spent the next 48 hours rebuilding the server with no sleep and a lot of shame.
1.1 the core lesson
That day taught me one hard rule: In Linux, “it works” is not enough. You must know why it works.
This article is not a list of commands. It is a survival foundation to keep you safe from 3 a.m. panic calls.
Mindset: avoid copy-paste engineering
The biggest trap for beginner sysadmins is dependency on instant tutorials.
You see an error, copy it to Google, open the first StackOverflow result, and paste the fix into production.
Stop. Breathe.
I have watched new admins do this. Sometimes I want to slap their keyboard. “Read first,” I say. “You just told the system to delete root.”
2.1 a risky habit
Linux is obedient. If you tell it to destroy itself, it will do it without hesitation.
System administration is not about memorizing 1000 commands. It is about understanding the system anatomy. Let us break it down properly.
Identity, privilege, and context
Before touching production, know who is executing a command and under what context.
3.1 core commands
whoami,id,groupssudo -lumask
3.2 practical rules
- Run commands as a regular user first.
- Use
sudoonly when truly required. - Separate admin, service, and app accounts.
File permissions and ownership
Back to my fatal mistake: chmod 777.
Linux enforces strict ownership and permissions. Every file has an owner (user) and a group (group).
- Read (4): view content.
- Write (2): modify or delete.
- Execute (1): run a program or enter a directory.
4.1 why 777 is dangerous
777 means everyone can read, write, and execute. It is like leaving your house unlocked with a sign saying, “Take whatever you want.”
4.2 least-privilege practice
Never use 777 in production.
Apply least privilege so the app can run without exposing the system.
- Config files:
640or644(avoid world-read for sensitive data). - Executable scripts:
755(rwxr-xr-x). - Public upload directories: allow write only for the service account (for example
www-data).
4.3 permission checklist
ls -lahchown -R user:groupchmod u=rw,g=r,o=
Also learn setuid, setgid, and the sticky bit (/tmp uses it). These can be escalation paths if ignored.
During client audits, I often think: “Who gave root ownership to this public folder?”
Processes and load average
Slow server? Do not restart first. Diagnose.
5.1 reading load average
Use top or htop. Load average shows 1, 5, and 15-minute windows.
Supermarket analogy:
Your CPU is a cashier.
- Load 0.0: idle.
- Load 1.0: one person in line.
- Load 5.0 (single core): five people in line. One is served, four are waiting.
If you have 4 cores, a load of 4 is acceptable. A load of 20 is a disaster.
Technical context:
- Load average = runnable tasks + uninterruptible sleep (often I/O wait).
- High load can mean CPU saturation or slow storage.
5.2 diagnosis tools
Use a combination:
toporhtopvmstat 1forwaandriostat -xz 1for disk latency and utilization
5.3 process states and what they mean
A process is rarely just “running” or “stopped.” The ps output shows a state code that tells you exactly what it is waiting for.
| Code | State | Meaning |
|---|---|---|
| R | Running | Actively using CPU or in the run queue |
| S | Sleeping | Waiting for an event to complete |
| D | Uninterruptible sleep | Blocked on I/O, usually disk |
| Z | Zombie | Terminated but not reaped by parent |
| T | Stopped | Paused by signal (SIGSTOP) |
A high count of D state processes means your storage subsystem is saturated. The CPUs look idle, top shows low CPU usage, but the system is crawling. That is I/O wait, and it is the most common misread in server performance.
5.4 cgroups and resource control
Modern Linux distributions use cgroups v2 to track and limit resource usage per process group. Systemd creates a cgroup for every service automatically. This is how Docker, Podman, and Kubernetes enforce resource limits.
# See cgroup hierarchy for a service
systemd-cgls

# Check CPU and memory accounting
systemd-cgtop

# Show resource usage of a specific service
systemctl show nginx.service --property=MemoryCurrent,CPUUsageNSec
When you set --memory 512m in a Docker container, Docker writes that limit into the container’s cgroup. The kernel enforces it. If the process exceeds the limit, the OOM killer terminates it.
5.5 performance profiling
When top and vmstat are not enough, reach for deeper tools.
# Per-process CPU breakdown
pidstat 1

# Off-CPU analysis (what is blocking the process)
perf record -e sched:sched_switch -g -- sleep 10
perf report

# Open file descriptors per process
lsof -nP | wc -l

# Strace for syscall-level debugging
strace -p 12345 -e trace=network -c
I use pidstat before top when I suspect a single process is the culprit. It shows per-process CPU, memory, and context switch counts in one view.
5.6 killing with etiquette
Find the culprit: ps aux | grep [process_name]. Then be careful with kill.
kill -15 [PID](SIGTERM): graceful shutdown.kill -9 [PID](SIGKILL): force stop. Last resort only.
I once ran
kill -9on a database during heavy transactions. Corrupted data followed.
Memory, cache, and oom
Linux uses RAM for cache. That is normal.
6.1 oom signals
Key commands:
free -h(checkavailable)cat /proc/meminfodmesg -T | grep -i oom
Common signals:
- processes die without clear errors
- logs show
Out of memory: Kill process - heavy swap and high
si/soinvmstat
6.2 mitigation strategy
Do not just add RAM. Check for memory leaks, profile the app, and apply cgroup limits.
Log files and investigation
Your black box is /var/log.
7.1 key log locations
/var/log/syslogor/var/log/messages/var/log/nginx/error.logjournalctl -xe
7.2 reading in real time
Use tail -f to watch logs live. Reproduce the error and read the output.
There is a quiet satisfaction when your eyes catch the exact line: “Out of Memory: Kill process mysqld”.
Related: Docker container crash case study
Disk usage and inodes
“Disk full even though files look small.” Classic.
8.1 size vs inodes
Disk can be full for two reasons:
- Size full: large files.
- Inodes full: too many small files.
Check with df -i.
8.2 cleanup tactics
Use du -h --max-depth=1 / | sort -hr for size, and find . -type f -delete to clean inode-heavy folders.
I once found 4 million spam queue files that crashed a mail server.
Filesystem and mounts
Production issues often come from bad mounts or unstable storage.
9.1 essential tools
lsblk,blkidmount,findmntfstab
9.2 safer practices
- Mount by UUID, not
/dev/sdX. - Use
nofailandx-systemd.automountfor non-critical disks. - Watch I/O errors with
dmesg -T | grep -i error.
Storage management with LVM
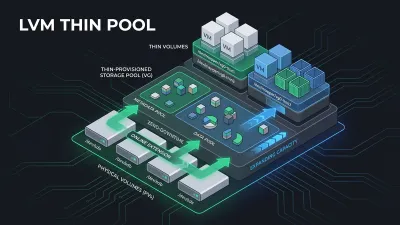
Logical Volume Manager (LVM) is the abstraction layer between physical disks and filesystems that every production sysadmin should understand. It decouples storage allocation from hardware, so you can resize, snapshot, and migrate volumes without touching the hardware underneath.
10.1 the three-layer model
LVM has three layers, and you must understand all of them before touching anything.
- Physical Volume (PV): A disk or partition marked for LVM use.
/dev/sda1,/dev/nvme0n1p1. - Volume Group (VG): A pool of storage assembled from one or more PVs.
- Logical Volume (LV): A virtual partition carved from the VG. This is what holds your filesystem.
# List physical volumes
pvs

# List volume groups
vgs

# List logical volumes
lvs

# Detailed view
pvdisplay
vgdisplay
lvdisplay
10.2 common LVM operations
Creating a logical volume:
pvcreate /dev/sdb
vgcreate data_vg /dev/sdb
lvcreate -L 100G -n data_lv data_vg
mkfs.ext4 /dev/data_vg/data_lv
mount /dev/data_vg/data_lv /data
Extending a volume when disk fills up:
# Add a new disk to the volume group
pvcreate /dev/sdc
vgextend data_vg /dev/sdc

# Extend the logical volume
extend the logical volume
lvextend -L +50G /dev/data_vg/data_lv

# Resize the filesystem
resize2fs /dev/data_vg/data_lv
XFS uses xfs_growfs instead of resize2fs. Always check the filesystem type before resizing, wrong command, no data.
10.3 snapshots for safe changes
LVM snapshots let you freeze a volume at a point in time. They are not backups, but they are invaluable before risky operations like kernel upgrades or application updates.
# Create a snapshot (allocate space for changes)
lvcreate -L 10G -s -n data_snap /dev/data_vg/data_lv

# Mount the snapshot read-only to verify
mkdir /mnt/snap
mount -o ro /dev/data_vg/data_snap /mnt/snap

# Roll back if something breaks
lvconvert --merge /dev/data_vg/data_snap
Snapshots use copy-on-write. The initial snapshot is near-instant regardless of volume size. Performance degrades as the snapshot diverges from the original, so do not keep them around longer than necessary.
10.4 recovering from a missing PV
A missing PV is the most common LVM emergency. A disk fails, reboots with a different device name, or a cable comes loose, and the volume group goes offline.
# Scan all disks for LVM metadata
pvscan

# If the PV appears as missing
vgreduce --removemissing data_vg

# Or if the disk is back but renamed
pvcreate /dev/sdc --restorefile /etc/lvm/archive/data_vg_*.vg
vgcfgrestore data_vg
The exact recovery steps depend on whether the data is intact. I covered a full production LVM recovery, including a case where pvscan could not find the disk, in the LVM error case study. When pvscan does not find a disk at all, even though lsblk still shows it, the cause is usually a device filter or a stale LVM cache, which I break down in pvscan not finding disk troubleshooting.
Networking for sysadmins
Sometimes the problem is not the server, but the network.
10.1 must-have tools
pingcurl -vss -tulpn
10.2 DNS and ports
Extra essentials:
- DNS debug:
dig +short domain,resolvectl status,/etc/resolv.conf - TCP:
ss -tan state established - Firewall:
ufw statusoriptables -L -n -v/nft list ruleset
DNS records do more than resolve hostnames. TXT records like SPF, DKIM, and DMARC decide whether your emails land in the inbox or the spam folder. When mail quietly fails, reading those records with dig is the first step. I broke down a full email deliverability troubleshooting case study with SPF, DKIM, and DMARC checks. When you need to inspect records without SSH access to a server, my DNS health check tool resolves A, MX, and the SPF/DKIM/DMARC records of any domain right from the browser. And if you are weighing whether to expose a service through a tunnel or open a firewall port, Cloudflare Tunnel vs port forwarding compares both approaches with real trade-offs.
Security fundamentals for linux servers
Security is not a feature you add later. It is a baseline you establish from the first command on a fresh server. Most compromises I have seen in my career did not involve sophisticated zero-day exploits. They involved an open SSH port with password authentication, a sudoer file that gave too much access, or a firewall that was never configured because “the server was not meant to be public.”
12.1 SSH key authentication and hardening
Password-based SSH is the single most common entry point for automated attacks. A server exposed to the internet with password auth on port 22 gets thousands of login attempts per day.
# Generate an ed25519 key (stronger than RSA for equivalent length)
ssh-keygen -t ed25519 -a 100 -f ~/.ssh/id_ed25519

# Copy it to the server
ssh-copy-id -i ~/.ssh/id_ed25519.pub user@server
Then harden the SSH daemon:
# /etc/ssh/sshd_config
Port 2222                    # Change from default 22
PermitRootLogin no           # Never allow root direct login
PubkeyAuthentication yes
PasswordAuthentication no    # Disable password auth
MaxAuthTries 3               # Limit brute force attempts
ClientAliveInterval 300
ClientAliveCountMax 2
Restart SSH after changes:
sudo systemctl restart sshdKeep your existing session open while you test the new connection in another terminal. Locking yourself out because of a typo in sshd_config is a rite of passage, but it is better to avoid it.
Stolen SSH keys are how attackers move from one machine to the next. I traced a full Linux server pivot attack scenario where a quiet server was hijacked as a stepping stone.
12.2 sudo discipline
The difference between a sysadmin who understands privilege and one who does not is visible in their sudo habits.
# Check what sudo rights a user has
sudo -l -U username

# Add a user to a specific group for delegated admin
sudo usecases
usermod -aG docker username   # Docker management only
usermod -aG www-data username  # Web service management

# Grant specific commands without full root
# /etc/sudoers.d/webadmin
%webadmin ALL=(root) NOPASSWD: /usr/bin/systemctl restart nginx, /usr/bin/systemctl reload nginx
The principle: grant the minimum privilege needed, not blanket root access. A team member who only manages Nginx does not need ALL=(ALL) ALL.
12.3 firewall essentials
A server with no firewall is a server waiting to be discovered by the next port scanner.
# UFW simple configuration
ufw default deny incoming
ufw default allow outgoing
ufw allow 2222/tcp           # Your custom SSH port
ufw allow 80/tcp
ufw allow 443/tcp
ufw enable
ufw status verbose
For nftables (modern replacement for iptables):
# /etc/nftables.conf
table inet filter {
    chain input {
        type filter hook input priority 0;
        policy drop;
        ct state established,related accept
        iif lo accept
        tcp dport { 2222, 80, 443 } accept
        icmp type echo-request limit rate 5/second accept
    }
    chain forward {
        type filter hook forward priority 0;
        policy drop;
    }
    chain output {
        type filter hook output priority 0;
        policy accept;
    }
}
12.4 fail2ban for SSH protection
Even with key-only auth, fail2ban adds a layer by blocking IPs that repeatedly fail authentication.
sudo apt install fail2ban
sudo cp /etc/fail2ban/jail.conf /etc/fail2ban/jail.local
Edit the local config to enable the SSH jail:
[sshd]
enabled = true
port = 2222
maxretry = 5
bantime = 3600
12.5 auditing user accounts
Over time, old accounts accumulate. Contractors leave, interns move on, and their accounts stay active.
# List all human users (UID >= 1000)
awk -F: '$3 >= 1000 && $3 < 65534 {print $1}' /etc/passwd

# Check for accounts with passwords
awk -F: '$2 != "*" && $2 != "!" && $2 != "" {print $1}' /etc/shadow

# List recent logins
last -10
I audit accounts every quarter. The process takes 15 minutes and has found ghost accounts every single time.
12.6 security updates
Unpatched software is the most predictable breach vector. Automate updates for security patches, but control the rollout.
# Ubuntu: enable unattended-upgrades for security only
sudo dpkg-reconfigure --priority=low unattended-upgrades

# Check pending security updates
sudo apt list --upgradable | grep -i security

# Subscribe to security advisories for your distro
# Ubuntu: https://ubuntu.com/security/notices
# Debian: https://security-tracker.debian.org/
The Linux server hardening best practices guide dives deeper into audit frameworks, CIS benchmarks, and intrusion detection. This section covers the baseline that every server should have before it serves traffic.
Hypervisors need the same discipline. The Proxmox CVEs and patching guide covers the update workflow, and the Proxmox VM attack case study shows what happens when a guest reaches the host.
In modern distros, systemd is the control center. Do not just restart, read status first.
11.1 status and logs
systemctl status servicejournalctl -u service -bsystemctl show service
11.2 troubleshooting flow
- Check status
- Read logs
- Fix config and permissions
- Restart after the fix
When a server feels slow but the basics look fine, my intermittent slow web server case study walks through this exact diagnosis flow in production.
Packages and updates
Blind updates in production are risky.
12.1 version control
apt-cache policyordnf infoapt-mark hold
12.2 update strategy
- Snapshot VM before major updates.
- Read changelogs for critical services.
- Test in staging before production.
Closing: mindset over memorization
Being a senior sysadmin is not about memorizing every tar flag. It is about calmness and method. If you are at a career transition point, my reflection on leaving the IT support comfort zone might be relatable.
When production goes down, follow this flow:
- Check connectivity.
- Check CPU and RAM.
- Read logs.
- Isolate the issue.
- Apply the fix.
Do not guess. Do not shoot in the dark.
Open your terminal. Type whoami. Take responsibility for every command you run.
Real scenario: walking through a slow disk
Let us combine everything above into one realistic troubleshooting session. A customer calls: the application is slow, but top shows CPU at 12%.
Step 1: check connectivity. curl -v https://app.example.com returns a response that starts but stalls halfway. Network layer is fine.
Step 2: check CPU and RAM. free -h shows plenty of available memory. No swap thrashing. So it is not memory pressure.
Step 3: read logs. dmesg -T | grep -i error returns a wall of disk I/O errors on /dev/sda. The load average is high, but the CPU is idle, which points at I/O wait.
Step 4: isolate. iostat -xz 1 confirms utilization at 100% with latency over 100ms. One disk, two failing sectors, and the RAID controller is re-reading repeatedly.
Step 5: apply the fix. Replace the failing disk, and in the short term move the database to the healthy disk. The application returns to normal within the hour.
Notice what did not happen here: no blind restart, no chmod 777, no guessing. Just a repeatable flow that ends with evidence. This is the difference between a button-pusher and a system administrator.
Quick reference: essential commands
| Purpose | Command |
|---|---|
| Who am I | id, whoami |
| What can I do | sudo -l |
| Permissions | ls -lah, stat |
| Find large files | du -h --max-depth=1 / | sort -hr |
| Inodes | df -i |
| Load & CPU | top, uptime |
| Per-process CPU | pidstat 1 |
| I/O wait | iostat -xz 1, vmstat 1 |
| Cgroup usage | systemd-cgtop |
| Open ports | ss -tulpn |
| Logs live | journalctl -f, tail -f |
| Kill gracefully | kill -15 PID |
| Mounts | findmnt, lsblk |
| LVM overview | pvs, vgs, lvs |
| Network | ss -tan, dig +short |
| SSH key gen | ssh-keygen -t ed25519 |
| Firewall | ufw status, nft list ruleset |
| Disk health | smartctl -a /dev/sda |
Keep this table within reach. When the 3 a.m. call comes, you want answers at your fingertips, not in your browser history.
Implementation Checklist
- Replicate the steps in a controlled lab before production changes.
- Document configs, versions, and rollback steps.
- Set monitoring + alerts for the components you changed.
- Review access permissions and least-privilege policies.
Official References
Need a Hand?
If you want this implemented safely in production, I can help with assessment, execution, and hardening.
Contact MeDeploy on Cloud Infrastructure with $200 Free Credit
Spin up high-performance SSD cloud Droplets, managed Kubernetes, and databases in seconds. Test your containers and production workloads with $200 in free credits.
Transparency: We independently test and operate all recommended infrastructure. If you use our partner links, you receive free promotional credits and support our testing lab at zero extra cost to you.
Weekly Production DevOps Runbooks
Join 1,000+ infrastructure engineers receiving real-world Linux troubleshooting, Proxmox clustering setups, and Docker optimization runbooks every Tuesday. Zero spam, unsubscribe anytime.
About the Author
Kamandanu Wijaya
IT Infrastructure & Network Administrator
Infrastructure & network administrator with 15+ years of enterprise experience, focused on stability, security, and automation.
Certifications: Google IT Support, Cisco Networking Academy, DevOps.
Docker Crash Loop: Incident Debugging Case Study
next →Cloud Server Slow Response Troubleshooting
Need IT Solutions?
DoWithSudo is ready to help setup servers, VPS, and your security systems.
Contact Us