The Mystery of the Restarting Containers, A Production Docker Troubleshooting Case Study
It was 10:15 PM when my phone started vibrating uncontrollably. Monitoring alerts flooded the screen: “Critical Alert: Web Service is Down”. As the one responsible for the infrastructure, my heart skipped a beat. This wasn’t just a minor glitch, it was our primary service, used by thousands of users at night.
In this article, we cover Docker container crash in a practical way so you can apply it with confidence.
I scrambled to open my laptop, brewed a quick instant coffee, and SSHed into the server. My mind was racing, trying to guess what went wrong. Was it a DDoS attack? Did the database explode? Or did I make a mistake during this afternoon’s deployment?
This incident taught me that in the world of Docker, a green status (Running) doesn’t always mean your application is healthy. Often, there’s a storm brewing beneath the surface of a simple docker ps command.
Let me walk you through the troubleshooting steps I took that night a journey from total confusion to finding the root causes, which turned out to be a combination of several small, overlooked details.
The symptoms: a never-ending alert loop
The initial user reports were clear: “The web is extremely slow, and we’re seeing frequent 502 Bad Gateway errors.”
The first thing I did was check the status of the running containers. With slightly shaking hands, I typed the “holy” command:
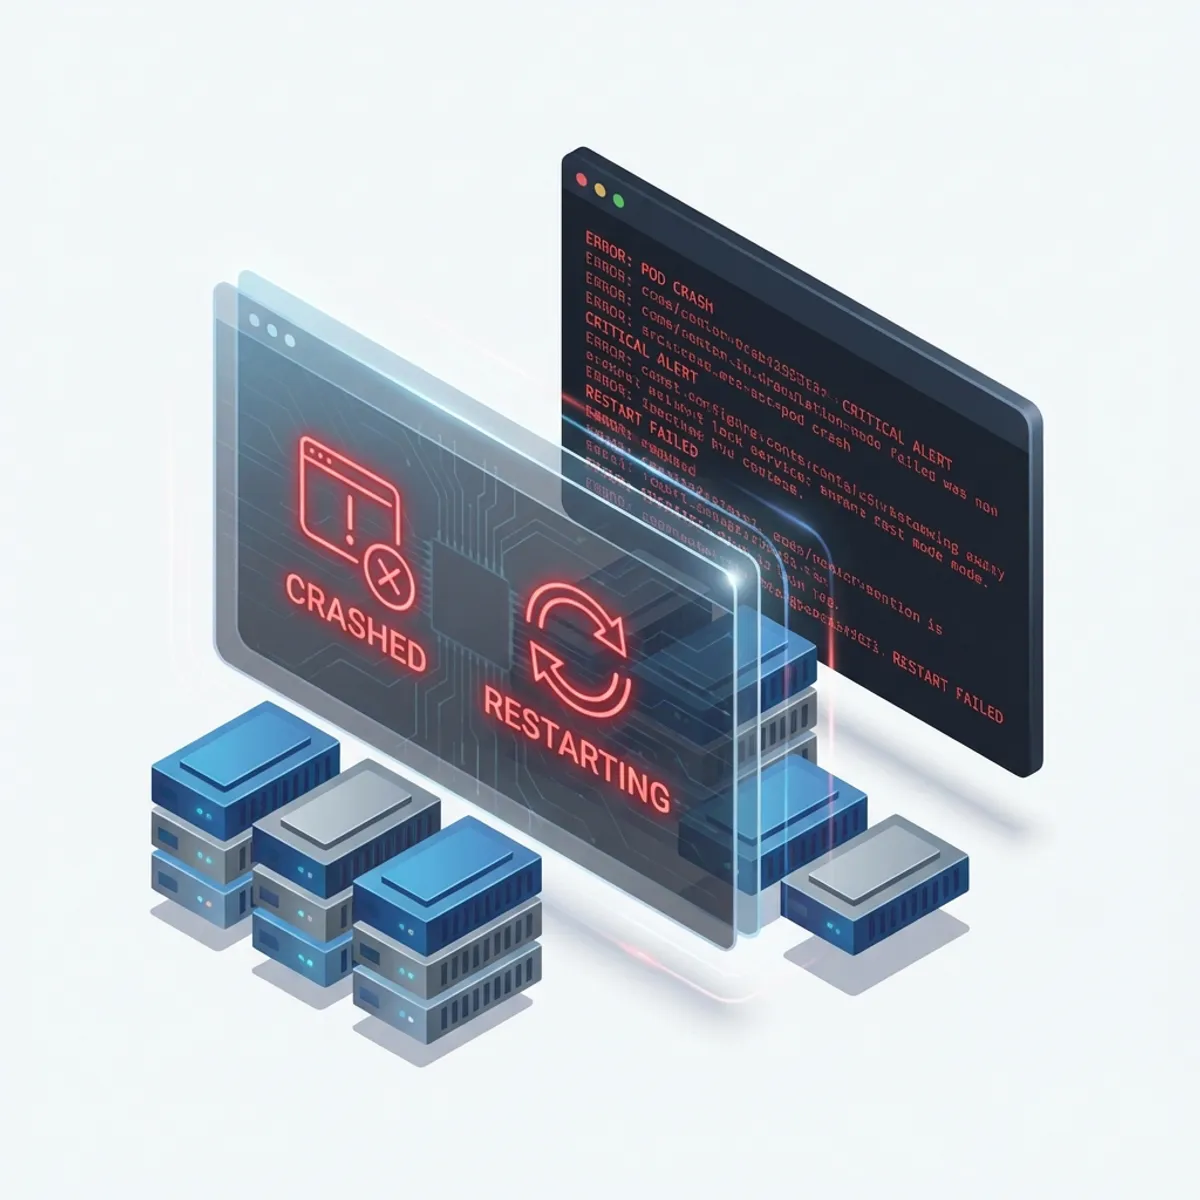
docker psThe output made me squint in confusion. My main web container showed a status of:
Up 45 seconds (restarting)
Every time I refreshed the command, that “45 seconds” would flip back to “2 seconds,” then “5 seconds,” then die again. This is what we call a Restart Loop. The container was trying to start, failing, dying, and being forced back to life by Docker’s restart policy.

Investigation phase 1: reading the death message
A common beginner mistake is to immediately restart the server or delete the container. Don’t do that! You need evidence. And that evidence is in the logs.
I tried to see what the dying container was trying to say:
docker logs web_app_containerThe logs were painfully brief, usually just containing:
[INFO] Starting application...
[ERROR] Could not connect to database at db_host:3306. Retrying...
[ERROR] Connection timeout. Exiting.
Okay, one clue found: the web app was dying because it couldn’t talk to the database. But wait I checked the database container, and its status was Up 3 hours. So, the DB was alive. Why was the app saying it couldn’t connect?
Investigation phase 2: finding the silent killer (oomkilled)
I dived deeper using docker inspect. This is how we look into the “guts” of a container.
docker inspect web_app_containerI searched for the State section. And there, I found the smoking gun:
"State": {
    "Status": "exited",
    "Running": false,
    "Paused": false,
    "Restarting": false,
    "OOMKilled": true,
    "Dead": false,
    "ExitCode": 137,
    "Error": "",
    "StartedAt": "2024-06-05T15:20:10Z",
    "FinishedAt": "2024-06-05T15:20:55Z"
}
OOMKilled: true. This meant the operating system had forcibly killed my container because it was using more RAM than allowed. Exit Code 137 is the classic fingerprint of an Out Of Memory (OOM) killer assassination.
It turned out that earlier that afternoon, I had restricted the container’s RAM to 512MB in the docker-compose.yml file, not realizing that during startup, the application spikes to about 600MB to scan libraries and initialize caches.

Investigation phase 3: the problem wasn’t over (disk full)
After I bumped the RAM limit, the web container started staying up longer. However, the server as a whole still felt sluggish. Even a simple ls command took 3 seconds to respond.
I checked the disk storage:
df -hThe output was staggering: Disk usage 99%. This was bizarre. This server has 100GB of disk space, and my app data isn’t even 10GB. Where did the rest go?
I used Docker’s built in cleanup tool to check the “trash”:
docker system dfIt turned out that Docker’s log files had ballooned to tens of Gigabytes. That container that was constantly restarting earlier? It had generated thousands of lines of heartless error logs. Because I hadn’t configured log rotation, Docker just kept writing until every byte of remaining disk space was gone.
When a disk is full, a database cannot write temporary files, subsystems slow down, and it triggers a domino effect that brings down the entire service.
Final solution: fixing the architecture
That night, I didn’t just increase the RAM. I overhauled the entire configuration to ensure this embarrassing incident would never happen again.
Here is a comparison of my problematic docker-compose.yml (from the afternoon) and the hardened version (from midnight).
Before the fix (full of gaps)
services:
  web:
    image: company/web-app:latest
    deploy:
      resources:
        limits:
          memory: 512M # Too small for startup spikes
    restart: always

  db:
    image: postgres:latest
    # No readiness checks for the database
After the fix (harden & observable)
services:
  web:
    image: company/web-app:latest
    deploy:
      resources:
        limits:
          memory: 1G # Increased for a safety margin
        reservations:
          memory: 512M
    logging:
      driver: "json-file"
      options:
        max-size: "10m" # Limit log size to prevent disk overflow
        max-file: "3"
    healthcheck:
      test: ["CMD", "curl", "-f", "http://localhost:3000/health"]
      interval: 30s
      timeout: 10s
      retries: 3
    depends_on:
      db:
        condition: service_healthy # Wait until DB is actually ready
    restart: unless-stopped

  db:
    image: postgres:latest
    healthcheck:
      test: ["CMD-SHELL", "pg_isready -U postgres"]
      interval: 10s
      timeout: 5s
      retries: 5
    volumes:
      - pgdata:/var/lib/postgresql/data

volumes:
  pgdata:
Root cause recapitulation
Once the sun came up and the system was stable, I sat back to reflect. This incident happened because three small oversights collided at the worst possible time:
- Wrong Memory Estimation: I only looked at RAM usage while the app was idle, not during the resource heavy startup phase.
- Startup Sequencing Issues: The web container tried to connect to the DB while it was still initializing files. Without a Healthcheck or Wait for it mechanism, the web app simply crashed upon the first failed attempt.
- Uncontrolled Logging: Without log rotation, a small incident can escalate into a disk space apocalypse.
Lessons learned from the field
For those managing containers in production, here is some hard earned advice from the front lines:
- Don’t Trust the Green Light: A container status of
Updoesn’t mean the application is functional. UseHealthchecksto verify the actual state of the application inside the container. - Observability is Everything: Without monitoring resource usage (RAM, Disk, CPU), you’re working in the dark. At the very least, set up alerts if server disk reaches 80%.
- Give Your Apps Room to Breathe: Don’t be too stingy with resource limits. Apps need extra room for unpredictable spikes during runtime (like Garbage Collection).
- Log Rotation is Mandatory: This is the first thing you should set up in the Docker daemon or every docker-compose file. Don’t let text files destroy your business.
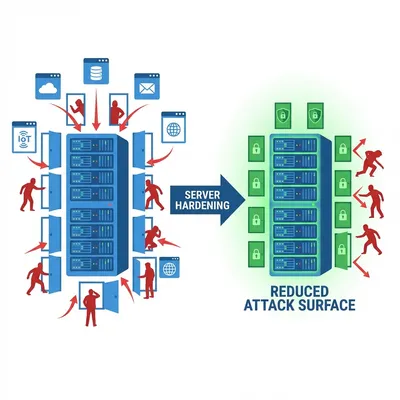
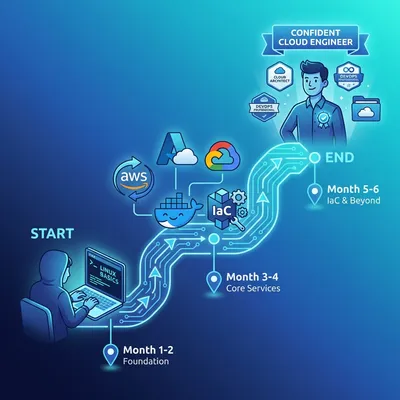
If you’re new to Docker and found some terms confusing, I recommend starting with my Docker beginner’s guide. For overall server security, also check out the Linux server hardening best practices.
Closing: the future of my deployments
Since that incident, I’ve overhauled our team’s deployment standards. Every configuration file now includes healthchecks and log limits by default. We also utilize external monitoring that periodically pings the /health endpoint.
If you ever get an alert in the middle of the night like I did, take a breath. Don’t panic. Docker gives you all the tools needed to diagnose the problem, you just need to know where to look.
I hope this troubleshooting story is helpful for your own journey and prevents your servers from suffering a similar fate. 🚀
I hope this guide on Docker container crash helps you make better decisions in real-world situations.
Implementation Checklist
- Replicate the steps in a controlled lab before production changes.
- Document configs, versions, and rollback steps.
- Set monitoring + alerts for the components you changed.
- Review access permissions and least-privilege policies.
Official References
Need a Hand?
If you want this implemented safely in production, I can help with assessment, execution, and hardening.
Contact MeAbout the Author
Kamandanu Wijaya
IT Infrastructure & Network Administrator
Infrastructure & network administrator with 14+ years of enterprise experience, focused on stability, security, and automation.
Certifications: Google IT Support, Cisco Networking Academy, DevOps.
View ProfileNeed IT Solutions?
DoWithSudo team is ready to help setup servers, VPS, and your security systems.
Contact Us