Case Study, Cloud Web Server Intermittent Down with Normal Load but Slow Response
A ticket came in from the customer support team. “Website sometimes works, sometimes does not. Has been like this for 3 days.”
In this article, we cover intermittent cloud webserver outage in a practical way so you can apply it with confidence.
I opened monitoring. CPU usage 20%. Memory usage 40%. Disk I/O normal. Load average 0.5 on a server with 4 cores. Everything looked fine.
But when I tried to access the website from a browser, it took 15 seconds to load the first page. Sometimes timeout. Sometimes normal. An inconsistent pattern.
“This is going to be interesting,” I thought. And indeed, this case taught me a lot about debugging things that do not show up in standard metrics.
Problem timeline
This client was running a Laravel based e-commerce application on a DigitalOcean droplet. The architecture was simple.
- 1 Droplet for web server (Nginx + PHP-FPM)
- 1 Managed Database (MySQL)
- Cloudflare as CDN and DNS
The application had been running smoothly for 8 months. No configuration changes in the last 2 weeks. Last deploy was a minor bug fix 5 days ago.
Suddenly, users started complaining. Checkout was slow. Product pages would not load. But not always. Sometimes normal, sometimes problematic.
Observed symptoms
From initial observation, this is the pattern I found.
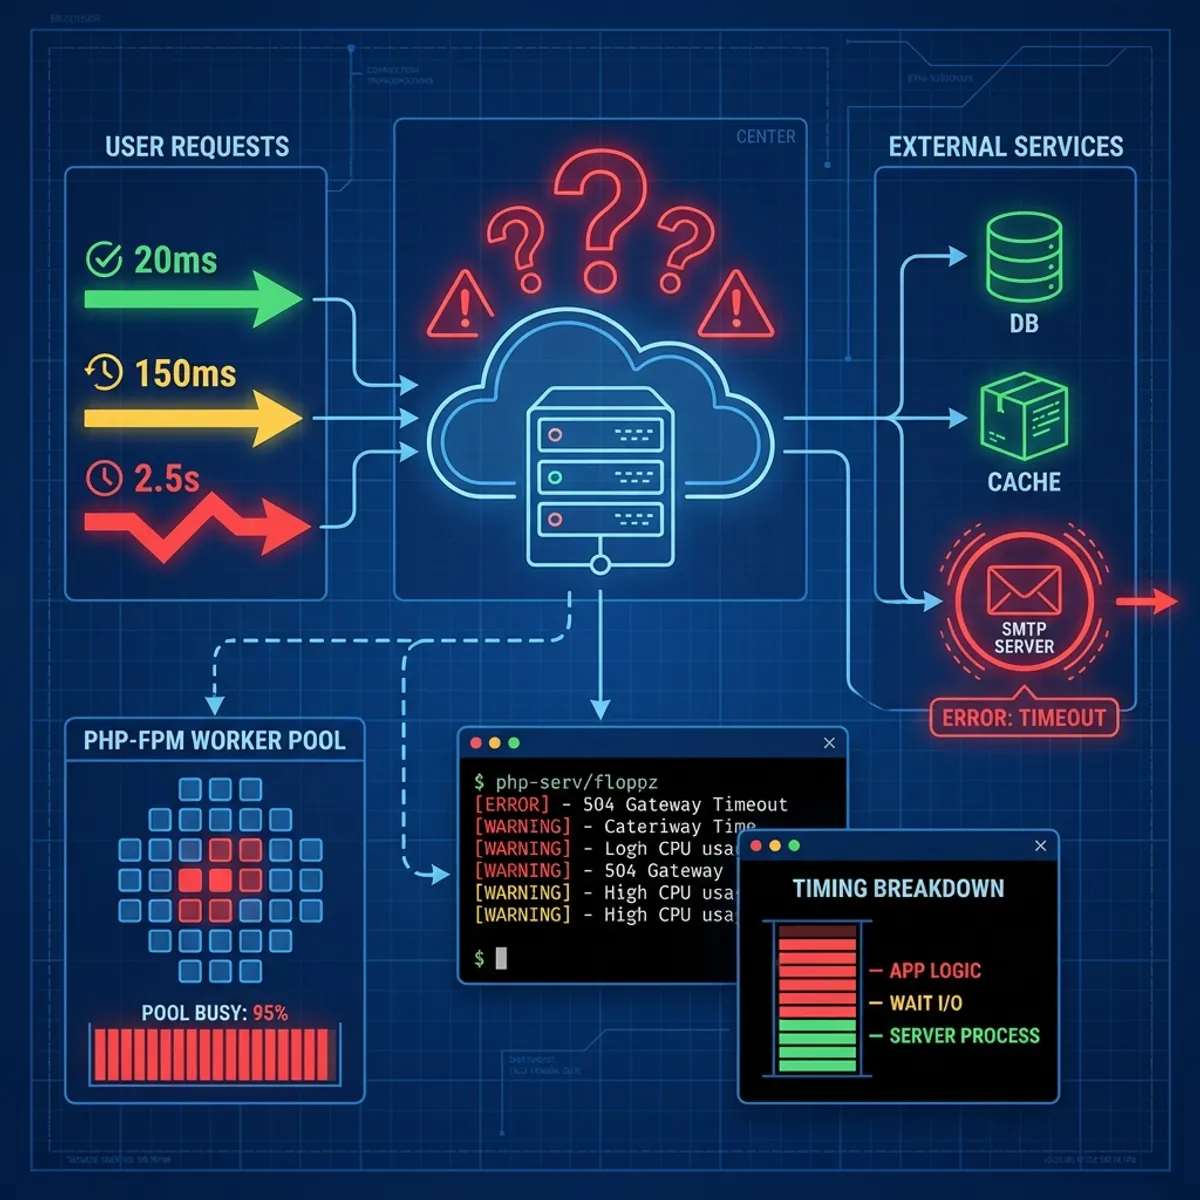
- Response time varied from 200ms to 30 seconds
- No correlation with specific times (morning, afternoon, night were all the same)
- Some requests timed out with status 504 (Gateway Timeout)
- Server metrics (CPU, memory, disk) always looked normal
- Database query time was also normal (under 100ms average)
“If it is not the server, not the database, then what?” This question kept spinning in my head.
Investigation process
I started with a systematic approach. Layer by layer.
Step 1: check from user perspective
Before diving into the server, I tested from the user side first.
curl -w "@curl-format.txt" -o /dev/null -s https://example.com/With a format file that displays time breakdown.
time_namelookup:  %{time_namelookup}\n
time_connect:  %{time_connect}\n
time_appconnect:  %{time_appconnect}\n
time_pretransfer:  %{time_pretransfer}\n
time_redirect:  %{time_redirect}\n
time_starttransfer:  %{time_starttransfer}\n
time_total:  %{time_total}\n
The result was surprising.
time_namelookup:  0.012
time_connect:  0.150
time_appconnect:  0.350
time_pretransfer:  0.350
time_starttransfer:  12.543
time_total:  12.890
DNS lookup and TCP connect were fast. But time_starttransfer (time until first byte received) was very long. This means the problem was in server processing, not network.
Step 2: check NGINX access log
Logged into the server, I analyzed the access log.
tail -f /var/log/nginx/access.log | awk '{print $NF}'The last column in Nginx log is usually request time. I saw many requests with times over 10 seconds. But strangely, not all. Some were 0.1 seconds, some were 15 seconds.
Step 3: check php-fpm status
Since this is a PHP application, I checked PHP-FPM status.
curl http://127.0.0.1/status?fullThe output showed something interesting.
active processes: 30
idle processes: 0
listen queue: 45
max listen queue: 128
All 30 PHP-FPM processes were active. None idle. And there were 45 requests waiting in queue.
“There it is,” I thought. PHP-FPM was running out of workers. But why? Load was not high.
Step 4: identify long running processes
I needed to know what was keeping PHP-FPM busy.
ps aux | grep php-fpm | awk '{print $2}' | xargs -I {} strace -p {} -cAfter a few minutes of observation, I saw a lot of time being spent in connect() and poll(). System calls that are usually related to network connections.
Step 5: check connections to external services
This Laravel application was connecting to several external services.
- Payment gateway
- Email SMTP
- Third party analytics
I tried curling each endpoint.
time curl https://payment-gateway.example/api/healthPayment gateway responded in 200ms. Normal.
time curl https://smtp.mailprovider.com:587Timeout after 30 seconds.
Bingo.
Root cause identified
It turns out the mail provider being used was experiencing issues in the Asia region. Every time there was a trigger to send email (order confirmation, password reset, notification), a PHP-FPM worker got stuck waiting for connection to the SMTP server.
Because email sending was done synchronously (not via job queue), every request that triggered an email would consume one PHP-FPM worker until timeout.
With 30 workers and an average of 10 requests per second triggering emails, workers ran out quickly. Other requests had to queue.
This explains why.
- Server metrics were normal (workers stuck in I/O wait, not CPU)
- Response was intermittent (only requests that triggered email were slow)
- No time pattern (depends on user action, not traffic volume)
Solutions applied
Immediate solution: disable email temporarily
The first step for recovery was to temporarily disable email sending.
In Laravel, I changed the configuration.
// config/mail.php
'default' => env('MAIL_MAILER', 'log'),
By switching to log, all emails would be written to a log file instead of being sent. The website immediately became responsive again.
Short term solution: queue email sending
Emails should not be sent synchronously. This is a best practice that is often overlooked.
// Instead of
Mail::to($user)->send(new OrderConfirmation($order));

// Use
Mail::to($user)->queue(new OrderConfirmation($order));
Setup a queue worker to process emails in the background.
php artisan queue:work --queue=emailsNow, even if the SMTP server is slow, the website remains responsive because emails are processed asynchronously.
Long term solution: timeout and fallback
Add reasonable timeouts for all external connections.
// config/mail.php
'smtp' => [
    'timeout' => 5, // 5 seconds max
],
And setup fallback. If the primary mail provider fails, use secondary.
try {
    Mail::mailer('primary')->to($user)->send($notification);
} catch (\Exception $e) {
    Log::warning('Primary mail failed, using fallback');
    Mail::mailer('fallback')->to($user)->send($notification);
}
Monitoring solution: alert for queue length
Add monitoring for PHP-FPM queue and external service health.
In Prometheus, I created an alert.
- alert: PHPFPMQueueHigh
  expr: phpfpm_listen_queue > 10
  for: 2m
  annotations:
    summary: "PHP-FPM queue is backing up"
With this, similar issues will be detected earlier.
For more comprehensive monitoring, I have written about the importance of monitoring and how to choose tools.
Lessons from this case
External dependencies are risk
Every time your application depends on an external service (third party API, SMTP, payment gateway), there is potential for failure. And that failure can cascade to the entire system.
Mitigation:
- Reasonable timeout for all external calls
- Circuit breaker pattern to auto-disable problematic services
- Async processing for operations that do not need immediate response
Standard metrics are not enough
CPU, memory, disk. These metrics are important, but they do not show the complete picture. PHP-FPM workers stuck in I/O do not create a CPU spike. But they still cause downtime.
Mitigation:
- Monitor application level metrics (queue length, response time distribution)
- Monitor external service health from your application’s perspective
Synchronous is an anti pattern for external calls
This is a lesson every developer must learn. Never make blocking calls to external services in the main request cycle.
Mitigation:
- Use job queues (Redis, RabbitMQ, database queue)
- Fire and forget if response is not needed
- Webhook or callback if you need asynchronous response
Documentation helps debugging
I was able to find the problem faster because there was documentation about what external services this application uses. Imagine if I had to trace through code to find all external calls.
Debugging checklist for slow response
Based on this experience, I created a checklist that can be used for similar cases.
- Verify from user perspective using curl with timing breakdown
- Check application server logs for response time patterns
- Check worker pool status (PHP-FPM, Puma, Gunicorn, etc)
- Identify blocking operations using strace or profiler
- Test connectivity to all external services one by one
- Review recent changes even if they seem unrelated
- Check for resource exhaustion that does not show in basic metrics (file descriptors, connection pool, worker count)
Closing thoughts
Debugging is an art. Sometimes the problem is obvious from metrics. Sometimes it hides in places you do not expect.
A server with load 0.5 can still be unresponsive. CPU at 20% does not mean everything is fine. Those numbers need context.
What differentiates experienced engineers is not the tools they use, but the ability to think systematically. Layer by layer. Eliminate possibilities one by one.
And always, always, pay attention to external dependencies. Because often, the biggest enemy is not from within, but from outside.
I hope this guide on intermittent cloud webserver outage helps you make better decisions in real-world situations.
Implementation Checklist
- Replicate the steps in a controlled lab before production changes.
- Document configs, versions, and rollback steps.
- Set monitoring + alerts for the components you changed.
- Review access permissions and least-privilege policies.
Official References
Need a Hand?
If you want this implemented safely in production, I can help with assessment, execution, and hardening.
Contact MeAbout the Author
Kamandanu Wijaya
IT Infrastructure & Network Administrator
Infrastructure & network administrator with 14+ years of enterprise experience, focused on stability, security, and automation.
Certifications: Google IT Support, Cisco Networking Academy, DevOps.
View ProfileNeed IT Solutions?
DoWithSudo team is ready to help setup servers, VPS, and your security systems.
Contact Us