How Important is Monitoring and How to Choose the Right Tools
“Why is the website down?”
In this article, we cover infrastructure monitoring in a practical way so you can apply it with confidence.
That question came from the Client. Directly in the my team WhatsApp group. 3 PM on a sunday.
I opened my laptop, checked the server. Everything looked normal. The website was accessible from the vpn network. But from outside? Unreachable.
It took 2 hours to find the problem. Turns out one of the load balancer nodes had a memory leak and stopped responding. But because there was no proper monitoring, there was no alert. No notification. We only found out after customers complained.
That experience changed how I view monitoring. From “nice to have” to “absolutely critical”.
Why monitoring is often neglected
Many IT teams, especially small ones, consider monitoring as something that can be postponed. The reasons vary.
“The server is still new, no need for monitoring yet.”
“We can check manually if there is a problem.”
“Setting up monitoring is complicated and time consuming.”
I used to think like that too. Until the incident above woke me up.
Reality on the ground
Without monitoring, you are only reacting. Not being proactive.
Imagine you have a car without a dashboard. No speedometer, no fuel indicator, no engine warning light. You can still drive, but you will not know there is a problem until the car breaks down in the middle of the road.
A server without monitoring is exactly like that.
When disk is almost full, you do not know. When memory usage spikes dramatically, you do not know. When there is unusual traffic spike, you do not know.
Until everything crashes.
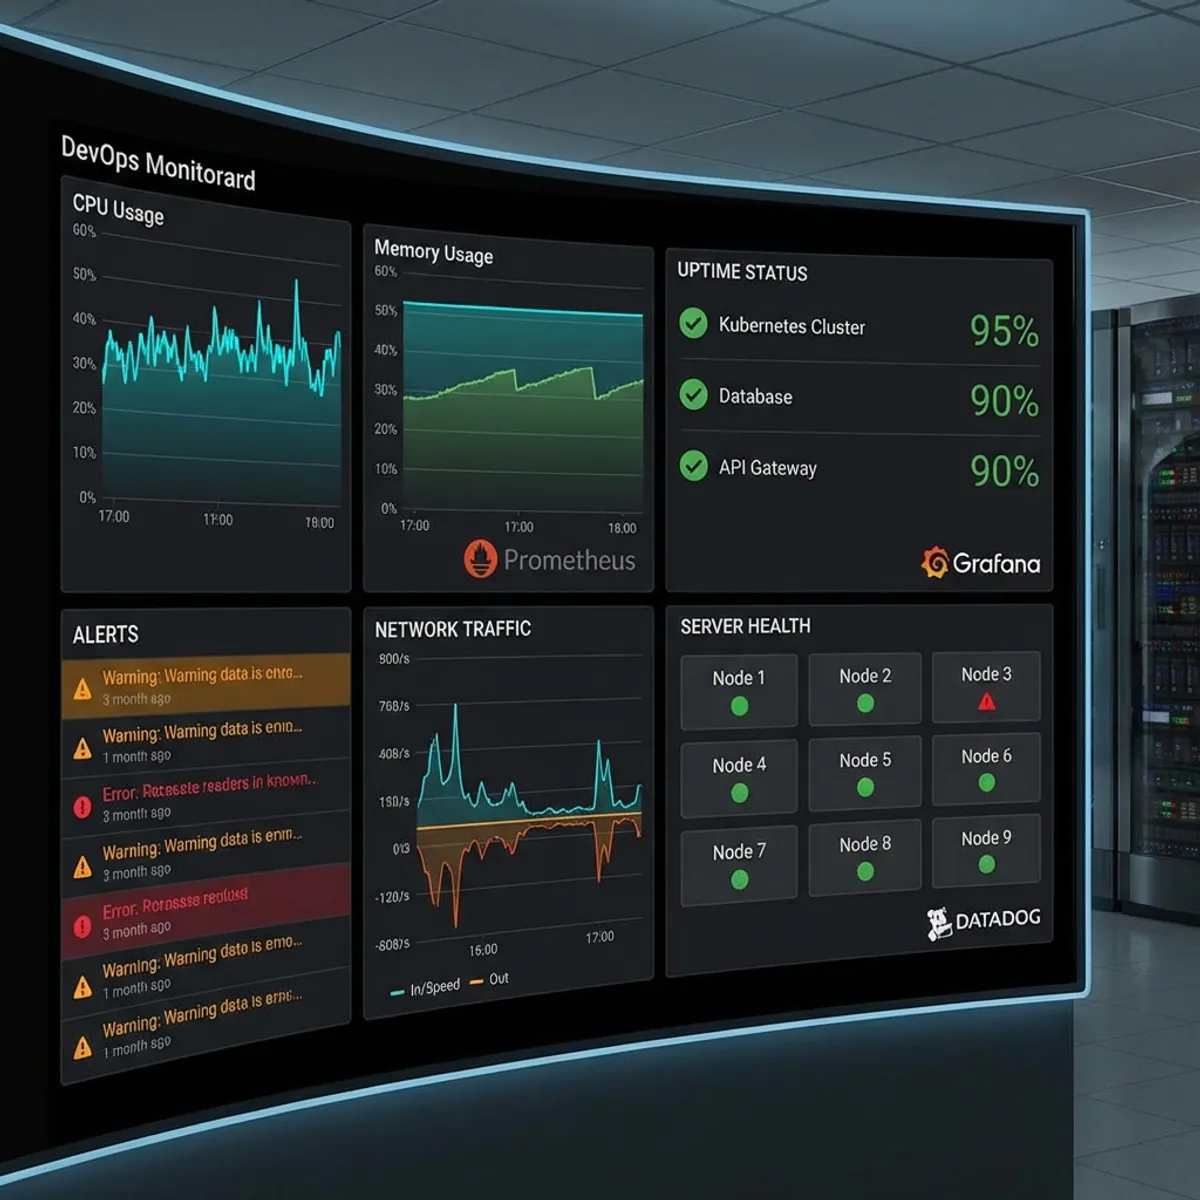
What should be monitored
Before talking about tools, let us first determine what needs to be monitored.
Infrastructure metrics
This is the foundation of all monitoring.
- CPU usage: Is the server working too hard?
- Memory usage: Is there a memory leak?
- Disk usage: Is storage almost full?
- Network I/O: Is there a bandwidth bottleneck?
- Load average: Is the system overwhelmed?
Application metrics
Besides infrastructure, applications also need to be monitored.
- Response time: How long does it take to process a request?
- Error rate: What percentage of requests fail?
- Requests per second: How much traffic is coming in?
- Database query time: Are there slow queries?
Business metrics
This is often forgotten, yet very important.
- Active users: How many users are currently using the system?
- Transaction volume: How many transactions per hour?
- Conversion rate: Are there anomalies in the funnel?
Log aggregation
Metrics alone are not enough. You also need logs for debugging.
- Application logs: Error messages, stack traces
- Access logs: Who is accessing what
- Security logs: Failed login attempts, suspicious activities
Popular monitoring tools comparison
There are many choices in the market. Here are some I frequently use.
Prometheus + Grafana
The most popular combination for open source monitoring.
Pros:
- Free and open source
- Flexible pull based model
- Powerful query language (PromQL)
- Wide ecosystem of exporters
- Beautiful Grafana dashboards
Cons:
- Initial setup can be complex
- Requires sufficient storage for time series data
- No good built in alerting UI (needs Alertmanager)
Good for: Teams that have resources to setup and maintain themselves.
Datadog
A very complete commercial monitoring platform.
Pros:
- Very easy setup
- Intuitive UI
- APM, logs, and metrics in one platform
- Integration with hundreds of services
- Responsive support
Cons:
- Expensive, especially for large infrastructure
- Vendor lock in
- Pricing can be confusing
Good for: Companies with budget that need a quick solution.
Zabbix
A veteran in the monitoring world, around since 2001.
Pros:
- Free and open source
- Very complete features
- Good auto discovery
- Can monitor almost any type of device
Cons:
- UI feels outdated
- Learning curve is quite high
- Documentation can be confusing
Good for: Organizations that need traditional infrastructure monitoring.
Uptime kuma
A lightweight solution for uptime monitoring.
Pros:
- Very easy setup (one Docker container)
- Modern and clean UI
- Notifications to many channels
- Self hosted, free forever
Cons:
- Focus only on uptime, not detailed metrics
- No APM or log aggregation
Good for: Simple endpoint monitoring, suitable for startups or personal projects.
Netdata
Real time monitoring with attractive visualization.
Pros:
- One command installation
- Detailed real time dashboard
- Lightweight, not much overhead
- Free for basic usage
Cons:
- Alert configuration not as flexible as Prometheus
- Cloud version is paid for full features
Good for: Quick setup to see what is happening on a server.
How to choose the right one
There is no one size fits all solution. The choice depends on several factors.
Consider budget
If budget is limited, Prometheus + Grafana is a solid choice. The investment is in setup time and learning curve.
If budget is available and you need to be running quickly, Datadog or other SaaS solutions make more sense.
Consider team skills
Open source tools require expertise to setup and maintain. If the team does not have bandwidth for that, a SaaS solution is more practical.
Consider scale
For small infrastructure (less than 10 servers), Uptime Kuma or Netdata is enough to start.
For medium to large infrastructure, Prometheus + Grafana or Zabbix is more appropriate.
Consider specific needs
Need APM? Datadog or Jaeger.
Need log aggregation? ELK Stack or Loki.
Need network monitoring? Zabbix or PRTG.
Minimal setup i recommend
For startups or small projects, this is the minimal setup I suggest.
Level 1: uptime monitoring
Start with the most basic. You need to know when a website or API is down.
# docker-compose.yml for Uptime Kuma
version: '3.8'
services:
  uptime-kuma:
    image: louislam/uptime-kuma
    ports:
      - "3001:3001"
    volumes:
      - uptime-kuma-data:/app/data
    restart: unless-stopped

volumes:
  uptime-kuma-data:
Setup monitors for each important endpoint. Enable notifications to Telegram, Slack, or email.
Level 2: server metrics
After uptime, monitor server health.
Netdata can be installed in one command.
bash <(curl -Ss https://my-netdata.io/kickstart.sh)Or if you want something more proper, setup Prometheus with node_exporter.
Level 3: application metrics
Instrument your application to expose metrics.
For Node.js, use prom-client.
const client = require('prom-client');

const httpRequestDuration = new client.Histogram({
  name: 'http_request_duration_seconds',
  help: 'Duration of HTTP requests in seconds',
  labelNames: ['method', 'route', 'status']
});
Level 4: log aggregation
Centralize all logs to one place.
Loki + Grafana is a lightweight combination that works well for this.
Anti patterns i often encounter
Over the years, I have seen several common mistakes in monitoring implementation.
Alert fatigue
Too many alerts make people ignore them. If there is a notification every 5 minutes, nothing gets responded to.
Solution: Alert only for actionable things. CPU usage at 80% might not need an alert. CPU usage at 95% for 5 minutes? Needs one.
No baseline
How do you know something is abnormal if you do not know what is normal?
Solution: Collect data for a few weeks before setting thresholds. Understand the normal pattern.
Monitoring without runbook
Alert goes off, then what? If there is no documentation about what to do, the alert is useless.
Solution: Every alert should have a runbook. Steps to investigate and resolve.
Single point of monitoring
Monitoring server on the same server as the application. If that server dies, monitoring dies too.
Solution: Monitoring should be separate from what is being monitored. Ideally on a different machine or even a different cloud provider.
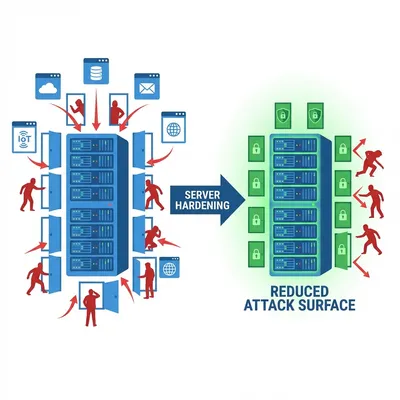
To ensure the monitored servers are also secure, make sure you have applied Linux hardening best practices.
Monitoring evolution in my team
I want to share how monitoring in my team evolved over time.
Year 1: No monitoring. Manual check via SSH.
Year 2: Basic uptime monitoring with Pingdom (free version).
Year 3: Self hosted Uptime Kuma + Netdata on every server.
Year 4: Prometheus + Grafana for metrics. Loki for logs.
Year 5: Full observability stack with tracing (Jaeger), APM, and custom dashboards.
You do not need to go straight to level 5. Start simple, iterate as needs grow.
Lessons i learned
First, monitoring is not an expense, it is an investment. Time spent on setting up monitoring will pay off many times over when incidents happen.
Second, start simple. Do not try to setup a complex monitoring stack on day one. Start with uptime, then expand.
Third, monitoring without a response plan is useless. Alerts must be followed by clear action.
Fourth, review and refine regularly. Monitoring needs change as infrastructure grows.
Closing thoughts
Monitoring is your eyes and ears in the infrastructure world. Without it, you are blind to what is happening in the systems you manage.
You do not need the most expensive or most sophisticated tools. What matters is visibility into system health.
Start with something simple. Uptime monitoring for important endpoints. Basic metrics for each server. Alerts to a channel that is definitely read.
Do not wait until the CEO asks “Why is the website down?” to think about monitoring.
Because by then, it is already too late.
I hope this guide on infrastructure monitoring helps you make better decisions in real-world situations.
Implementation Checklist
- Replicate the steps in a controlled lab before production changes.
- Document configs, versions, and rollback steps.
- Set monitoring + alerts for the components you changed.
- Review access permissions and least-privilege policies.
Official References
Need a Hand?
If you want this implemented safely in production, I can help with assessment, execution, and hardening.
Contact MeAbout the Author
Kamandanu Wijaya
IT Infrastructure & Network Administrator
Infrastructure & network administrator with 14+ years of enterprise experience, focused on stability, security, and automation.
Certifications: Google IT Support, Cisco Networking Academy, DevOps.
View ProfileNeed IT Solutions?
DoWithSudo team is ready to help setup servers, VPS, and your security systems.
Contact Us