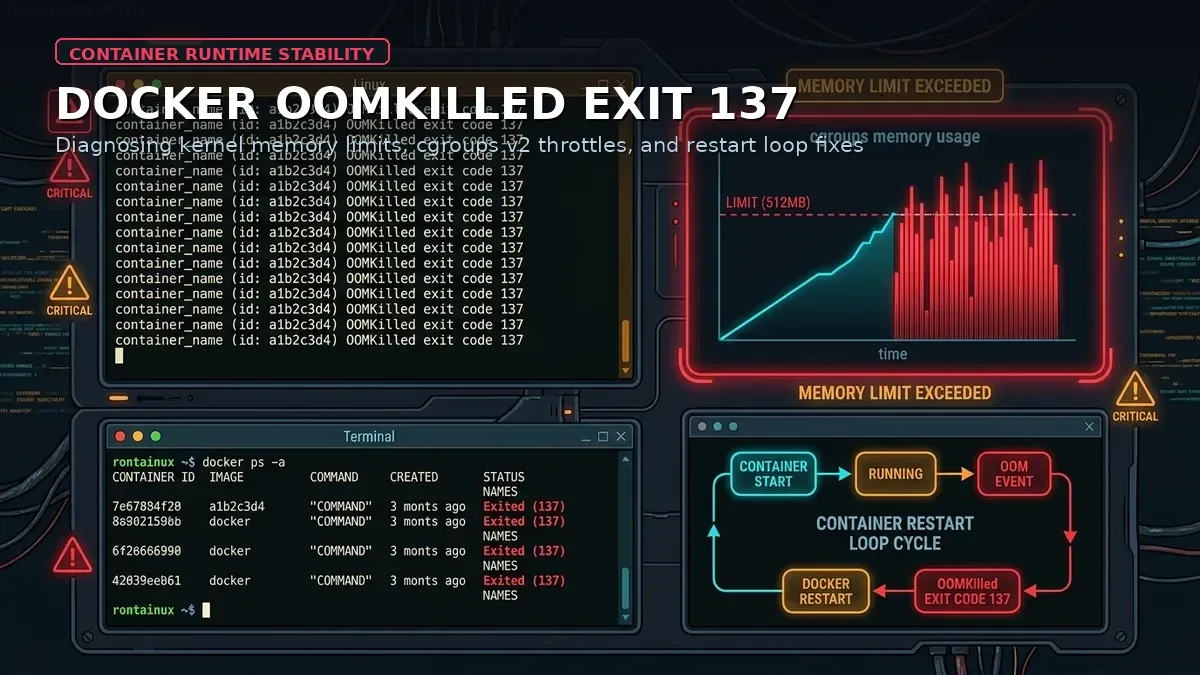
Docker OOMKilled: Fix Container Restart Loops
This article is part of the Production Docker series.
Article Details
Category
DevOpsThe Slack ping broke the evening silence: “API gateway returning 502 Bad Gateway intermittently. The payment service container keeps vanishing.”
I SSHed into the production host, checked the running processes with docker ps, and saw the dreaded pattern:
CONTAINER ID   IMAGE                 STATUS                          NAMES
a1b2c3d4e5f6   payment-service:v2    Restarting (137) 4 seconds ago   payment-api
Exit code 137.
To an inexperienced engineer, a container restarting every forty seconds looks like a software exception, an unhandled database timeout, or a networking glitch. The application developers spent three hours digging through application logs looking for null pointer exceptions, finding nothing.
The reason they found nothing is simple: the application never had the chance to write an error log.
The Linux kernel did not ask the application to exit. It did not send a polite SIGTERM. It walked up behind the process, pulled the trigger with a SIGKILL (signal 9), and purged its memory pages instantly.
This is the Linux Out-Of-Memory (OOM) Killer in action, orchestrated by Docker control groups (cgroups).
Here is how to diagnose Docker OOMKilled crashes with certainty, why exit code 137 happens, and how to calibrate memory limits so your containers stay stable under load.
The mathematics of Exit Code 137
Why does Docker report exit code 137?
In UNIX systems, when a process terminates via a fatal signal, its exit code follows a mathematical convention:
$$\text{Exit Code} = 128 + \text{Signal Number}$$
When the Linux kernel OOM Killer strikes, it issues SIGKILL (Signal 9):
$$128 + 9 = 137$$
Whenever you inspect a crashed container and observe Exit Code: 137, your application was killed abruptly from the outside. In 99% of containerized environments, that signal was triggered because the container violated its allocated memory boundary.
Process Allocates Heap Memory
       │
       ▼
Memory Usage Crosses Cgroup Boundary (e.g., 512 MB)
       │
       ▼
Host Linux Kernel Cgroup Subsystem Detects Violation
       │
       ▼
Kernel OOM Killer Dispatches SIGKILL (Signal 9)
       │
       ▼
Container Exits Abruptly ──► Docker Reports Exit Code 137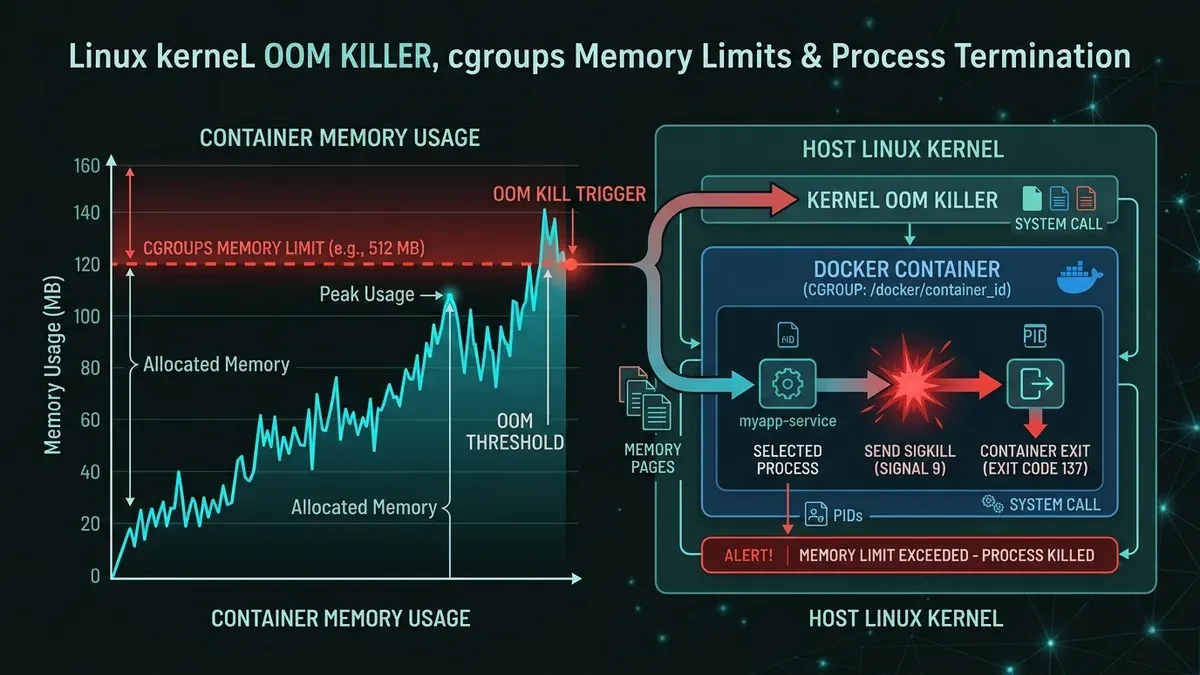
How to confirm OOMKilled with absolute certainty
Never guess whether a container crashed from memory exhaustion. Four commands provide undeniable proof.
Command 1: Inspect state.oomkilled in Docker
Docker tracks kernel OOM events directly in its container state metadata. Run docker inspect filtered with Go templating:
docker inspect payment-api --format '{{json .State}}' | jq '{Status: .Status, ExitCode: .ExitCode, OOMKilled: .OOMKilled}'If the kernel terminated your container due to memory limits, the output is unambiguous:
{
  "Status": "exited",
  "ExitCode": 137,
  "OOMKilled": true
}
If OOMKilled returns true, stop looking at your application stack traces. Your problem is strictly physical memory allocation or a runaway memory leak.
Command 2: Examine the host dmesg kernel ring buffer
When the kernel OOM killer fires, it logs an obituary in the kernel ring buffer. Check dmesg:
dmesg -T | grep -i -E 'oom[-_]killer|killed process'Output:
[Thu Sep  3 14:15:22 2026] Memory cgroup out of memory: Killed process 14205 (node) total-vm:845210kB, anon-rss:512400kB, file-rss:1240kB, shmem-rss:0kB, oom_score_adj:0
[Thu Sep  3 14:15:22 2026] oom_reaper: reaped process 14205 (node), now anon-rss:0kB, file-rss:0kB, shmem-rss:0kB
Notice the key phrase: Memory cgroup out of memory. This confirms the host itself had plenty of RAM, but the container’s private cgroup ceiling was breached.
Command 3: Monitor real-time memory usage with docker stats
Before a container crashes, monitor its consumption trajectory under traffic:
docker stats --no-stream payment-apiLook at the MEM USAGE / LIMIT and MEM % columns. If a container configured with a 512 MB limit hovers at 505 MB (98.6%), any sudden burst of incoming requests will immediately push it over the edge.
Common culprits behind container memory spikes
In production deployments, containers do not consume memory randomly. These four scenarios account for almost every OOM incident I have remediated:
| Culprit | Mechanism | Common Stack |
|---|---|---|
| JVM Unaware of Cgroups | Java defaults to 25% of host RAM, ignoring container limit | Java 8 / Spring Boot |
| Unbounded In-Memory Caches | Hash maps or dictionaries grow without eviction policies | Node.js, Python, Go |
| Streaming Large File Uploads | Buffering entire files into memory instead of disk streams | Any web API |
| Database Query Explosions | SELECT * on unindexed tables loading 100k rows into RAM | ORMs, Active Record |
In our Docker Container Crash troubleshooting case study, we analyzed an outage where a Node.js microservice kept crashing in production due to unhandled promise rejections and runaway heap allocations.
How to properly configure memory limits
Preventing OOM restart loops requires configuring both soft limits and hard limits in your container definition.
In Docker Compose
version: '3.8'

services:
  payment-api:
    image: payment-service:v2
    restart: unless-stopped
    deploy:
      resources:
        limits:
          cpus: '1.0'
          memory: 1024M
        reservations:
          cpus: '0.25'
memory: 512Mreservations.memory: The minimum guaranteed RAM allocated to the container.limits.memory: The hard ceiling. If the process exceeds 1024M, the kernel terminates it.
Note: current Compose v2 applies
deploy.resources.limitswhen you rundocker compose up. Legacydocker-compose(v1) ignores thedeploykey outside swarm mode, so use the top-levelmem_limit: 1024mandcpus: '1.0'fields there instead.
Enabling memory swap buffers
If an occasional burst of traffic causes temporary memory spikes, you can allow a small swap buffer so the container degrades in performance rather than crashing instantly:
docker run -d \
  --name payment-api \
  --memory=1g \
  --memory-swap=1.5g \
  payment-service:v2
Here, the container can use 1 GB of physical RAM plus 512 MB of swap disk space.
Runtime calibration for runtimes (Node.js and Java)
Setting Docker memory limits without tuning the runtime inside the container is a recipe for failure.
- For Node.js: By default, Node.js may try to allocate 1.4 GB of heap. If your container has a 512 MB limit, Node will crash before triggering garbage collection. Explicitly set:
ENV NODE_OPTIONS="--max-old-space-size=400" - For Java: Modern OpenJDK versions (11+) respect cgroups natively. Ensure your JVM flags align:
ENV JAVA_TOOL_OPTIONS="-XX:+UseContainerSupport -XX:MaxRAMPercentage=75.0"
Deep containerization fundamentals, from multi-stage builds to daemon performance tuning, are covered in our comprehensive Docker complete guide, and building a minimal image by hand is the fastest way to internalize them (Build a Docker Container from Scratch).
Real-world case study: The memory leak that only struck on Fridays
At a fintech startup I consulted for, the transaction processing container ran smoothly from Monday to Thursday. But every Friday afternoon, like clockwork, the container would die with exit code 137.
The development team blamed “traffic spikes at the end of the week.”
When we hooked up Prometheus and cAdvisor to graph memory over time, we saw a textbook linear sawtooth pattern:
Memory
  ▲
  │                                    /│ (OOMKilled - Exit 137)
  │                                  /  │
  │                                /    │
  │                              /      │
  │                            /        │
  │                          /          │
  │                        /            │
  │                      /              │
  │                    /                │
  │  ───────────────────────────────────┴────────► Time
     Mon        Tue         Wed        Thu       Fri
Memory was never being released. Each incoming transaction appended user metadata to an unindexed in-memory JavaScript array designed to “cache recent sessions.” Because the array had no size ceiling and no TTL eviction policy, the heap expanded by approximately 80 MB per day.
By Friday afternoon, the process hit its 512 MB cgroup ceiling, and the Linux kernel stepped in with SIGKILL.
The fix took five minutes: we replaced the global array with a bounded Redis cache with a 15-minute TTL. Memory consumption dropped from 500 MB to a flat 65 MB that never drifted by more than 2 MB.
Proactive alerting before OOM crashes strike
Do not wait for a customer to tell you that your container has vanished. Configure proactive alerts based on cgroups memory pressure.
In modern Linux kernels with cgroups v2, monitor Memory Pressure Stall Information (PSI):
cat /proc/pressure/memoryOutput:
some avg10=0.00 avg60=0.00 avg300=0.00 total=0
full avg10=0.00 avg60=0.00 avg300=0.00 total=0
When some or full pressure percentages rise above 15%, the Linux kernel is spending noticeable CPU cycles thrashing memory pages and running reclaim routines. This is your early warning that an OOM kill event is imminent within minutes.
Summary troubleshooting checklist
When a container enters an unexpected restart loop:
- Check container status: Is exit code 137 present?
- Run
docker inspect <container> --format '{{.State.OOMKilled}}'. - Inspect host logs with
dmesg -T | grep -i oom. - Verify if runtime memory flags (JVM
-Xmx, Node--max-old-space-size) match container cgroup limits. - Add monitoring metrics to alert when memory usage crosses 85% of assigned limits.
- Configure container swap allocation policies using memory-swap limits to cushion sudden temporary payload spikes.
- Validate kernel OOM score adjustments for critical core daemon processes to ensure helper scripts are killed before primary engines.
Keeping containers alive in production is not about giving every service infinite RAM. It is about understanding kernel boundaries, instrumenting memory visibility, and tuning application garbage collection to live harmoniously inside cgroups limits. For teams operating high-throughput machine learning workloads, examine our architecture breakdown of DeepSeek V4.1 Flash memory tiering and inference optimization to see how modern distributed systems decouple host DRAM from GPU memory.
This article is part of the Production Docker series.
Implementation Checklist
- Replicate the steps in a controlled lab before production changes.
- Document configs, versions, and rollback steps.
- Set monitoring + alerts for the components you changed.
- Review access permissions and least-privilege policies.
Official References
Need a Hand?
If you want this implemented safely in production, I can help with assessment, execution, and hardening.
Contact MeDeploy on Cloud Infrastructure with $200 Free Credit
Spin up high-performance SSD cloud Droplets, managed Kubernetes, and databases in seconds. Test your containers and production workloads with $200 in free credits.
Transparency: We independently test and operate all recommended infrastructure. If you use our partner links, you receive free promotional credits and support our testing lab at zero extra cost to you.
Weekly Production DevOps Runbooks
Join 1,000+ infrastructure engineers receiving real-world Linux troubleshooting, Proxmox clustering setups, and Docker optimization runbooks every Tuesday. Zero spam, unsubscribe anytime.

About the Author
Kamandanu Wijaya
IT Infrastructure & Network Administrator
Infrastructure & network administrator with 15+ years of enterprise experience, focused on stability, security, and automation.
Certifications: Google IT Support, Cisco Networking Academy, DevOps.
Proxmox Web UI Not Loading: Fix Port 8006 Connection Refused
Next →Cron Job Examples: Common Schedules Explained
Need IT Solutions?
DoWithSudo is ready to help setup servers, VPS, and your security systems.
Contact Us